


Free
Start here. See everything. When you're ready for Operator to work for you, upgrade to Pro.
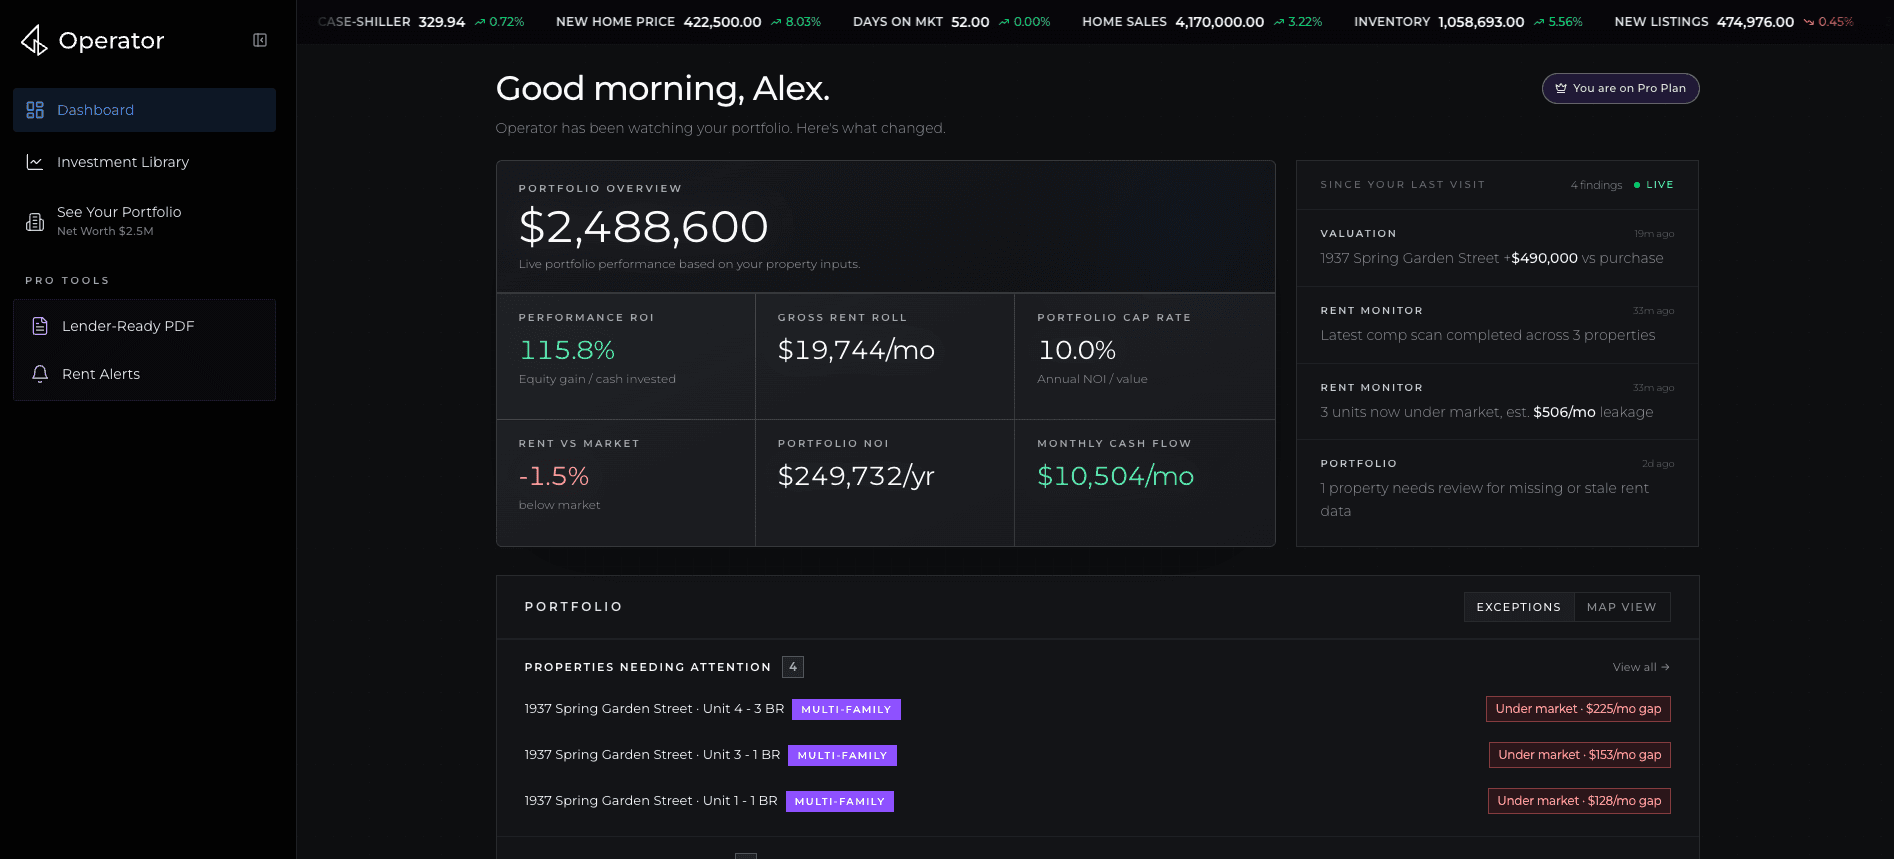
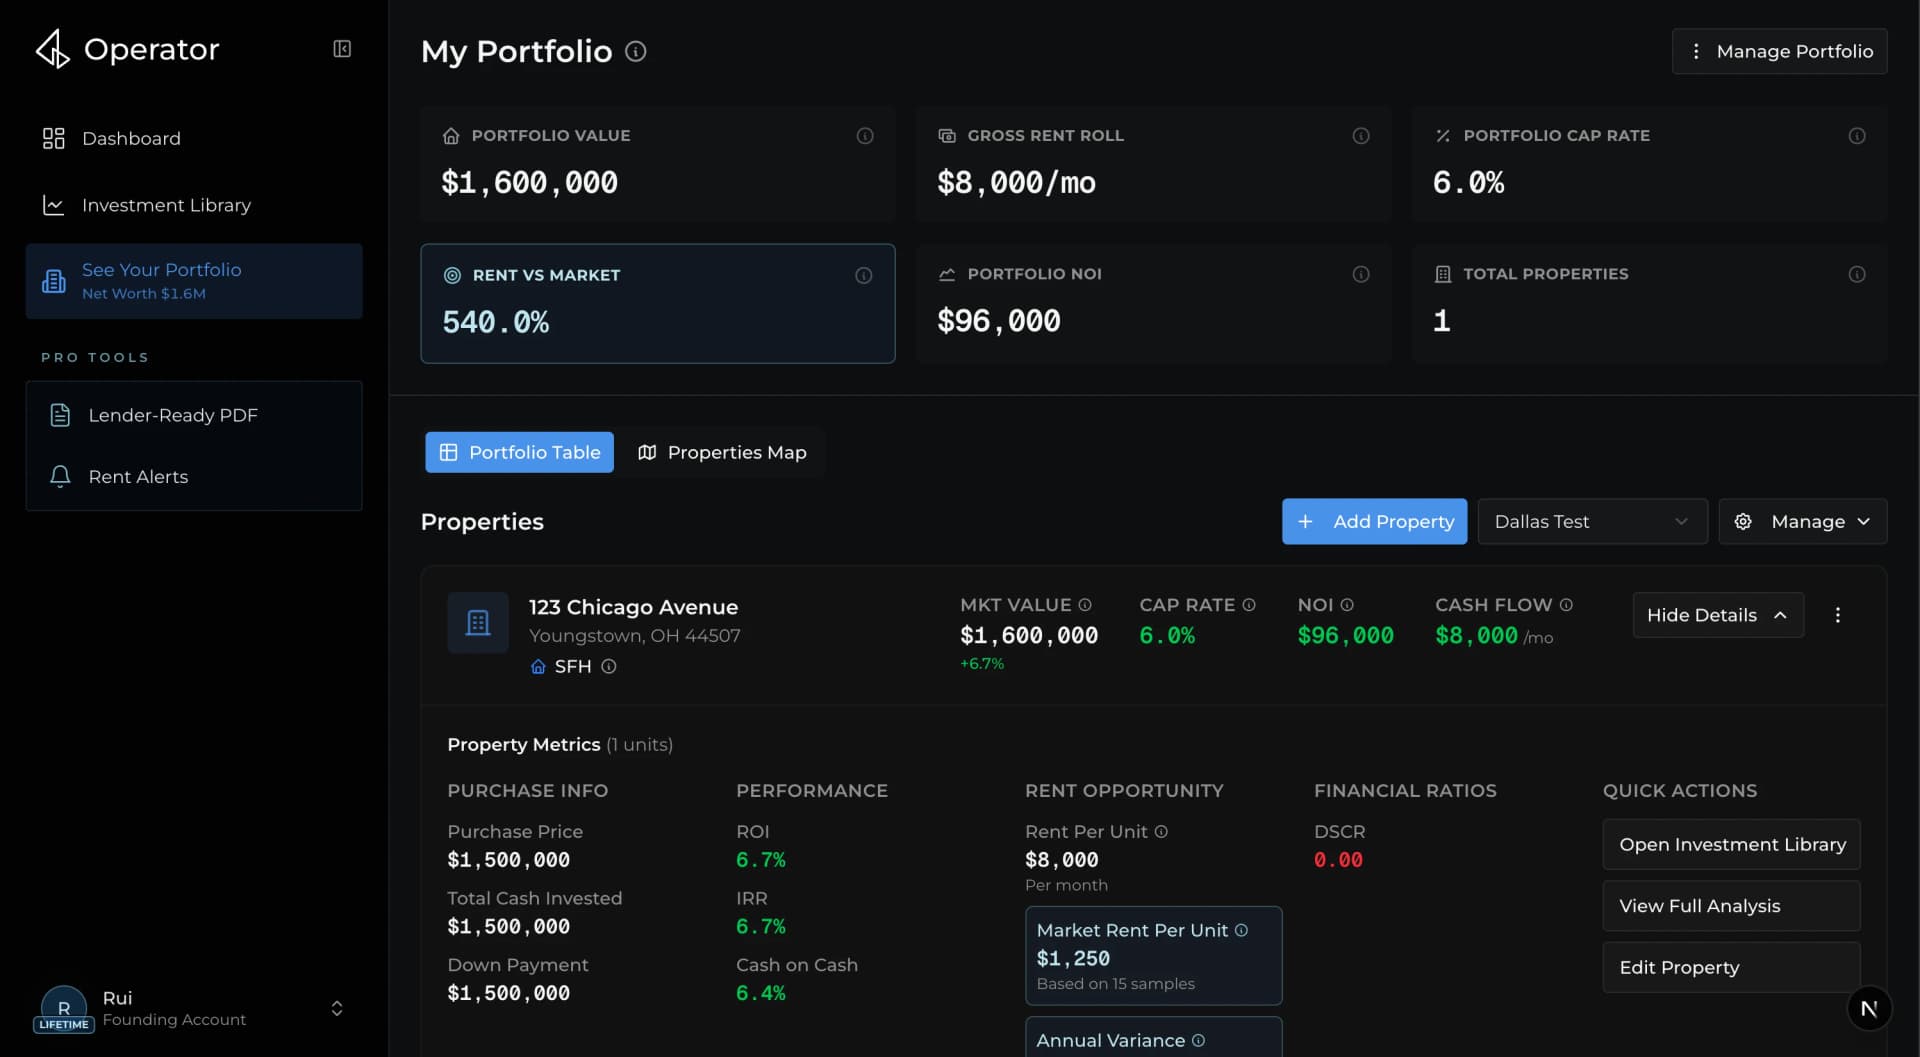
- Track every property in one dashboard
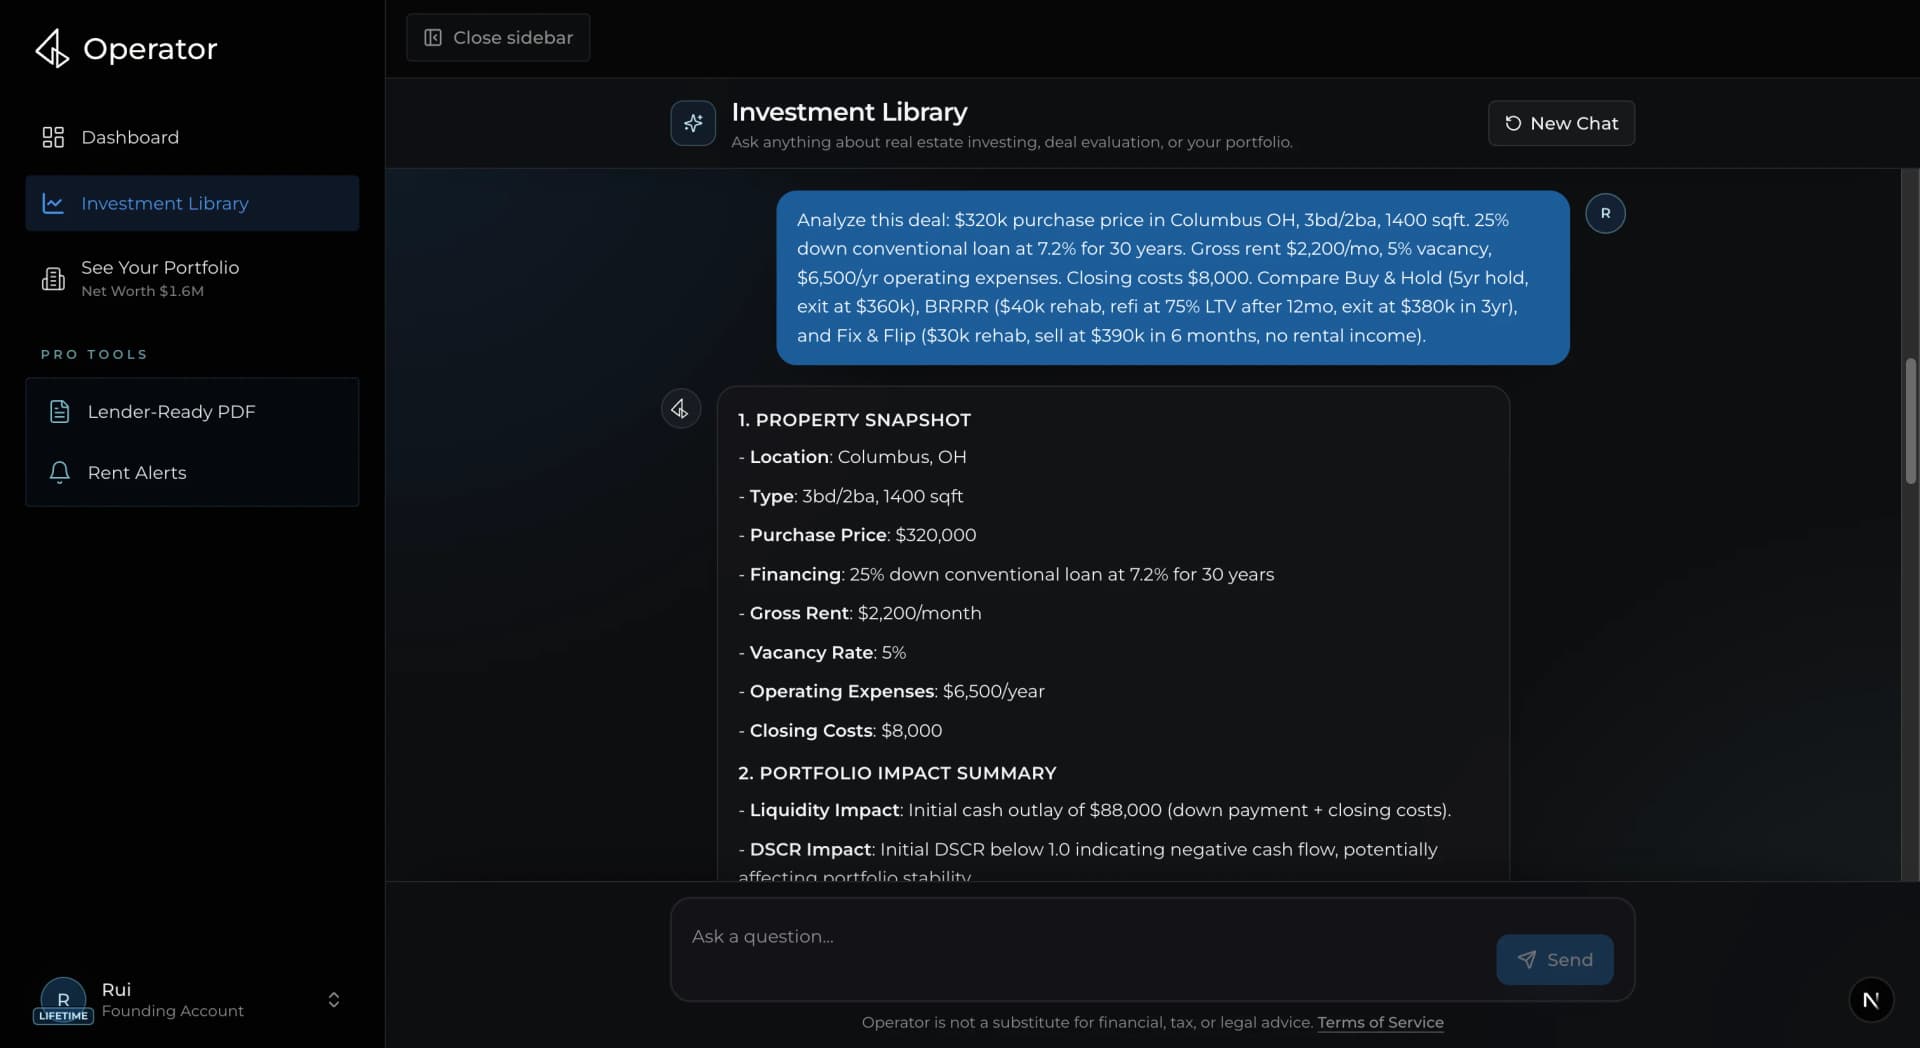
- See cash flow, NOI, cap rate, and CoC returns instantly
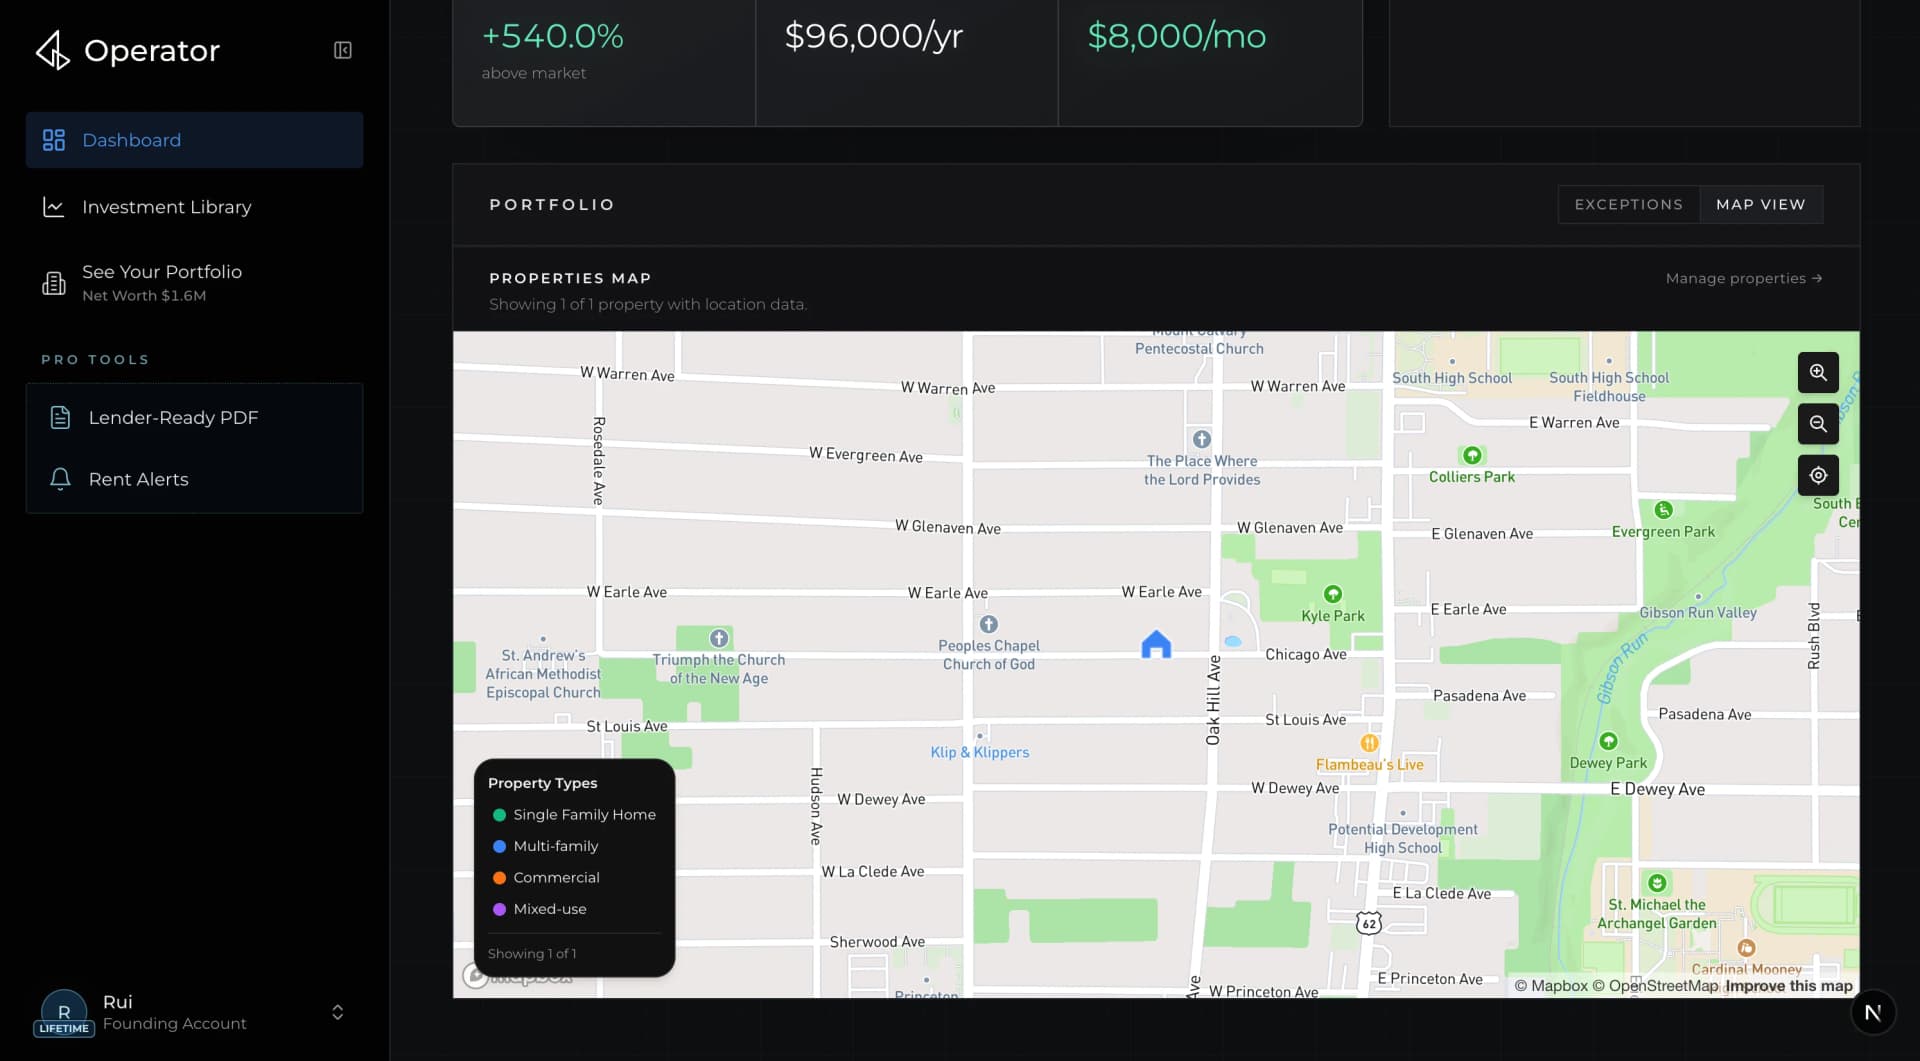
- View your portfolio on a map
- Automatic property value estimates*
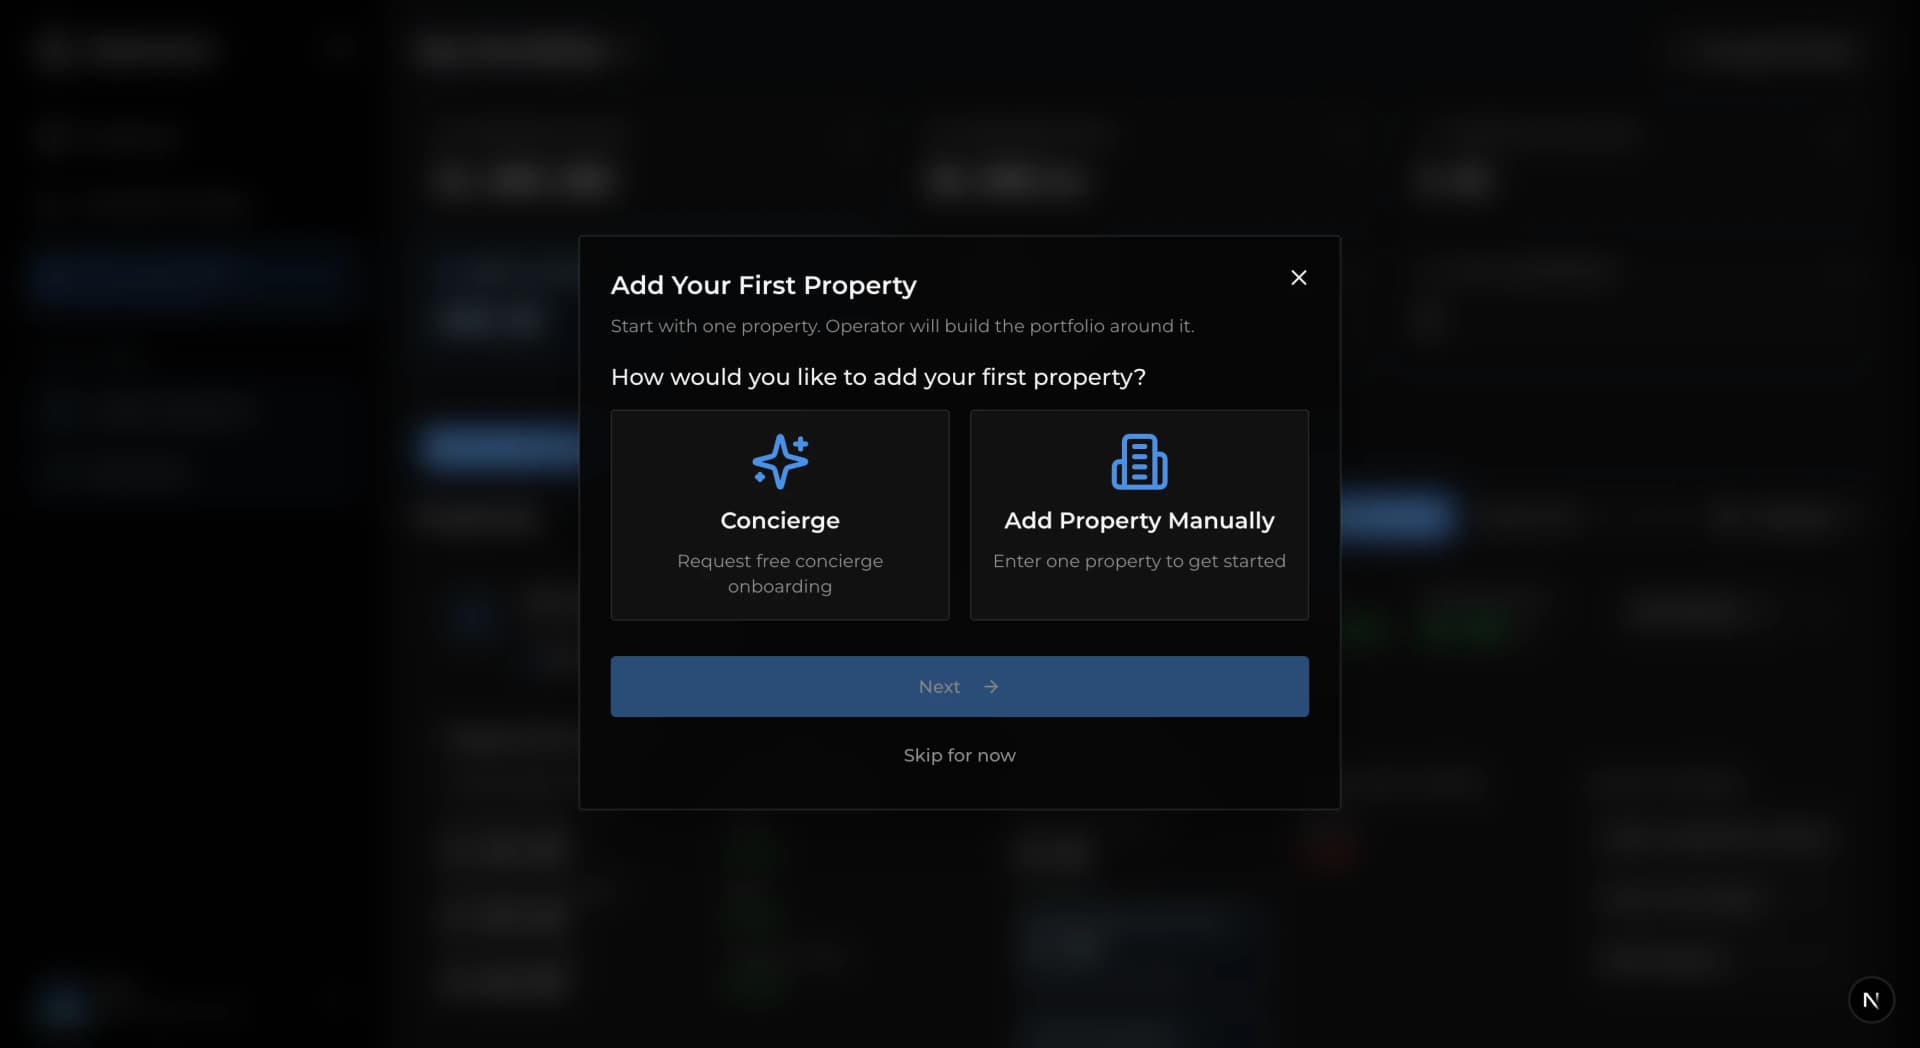
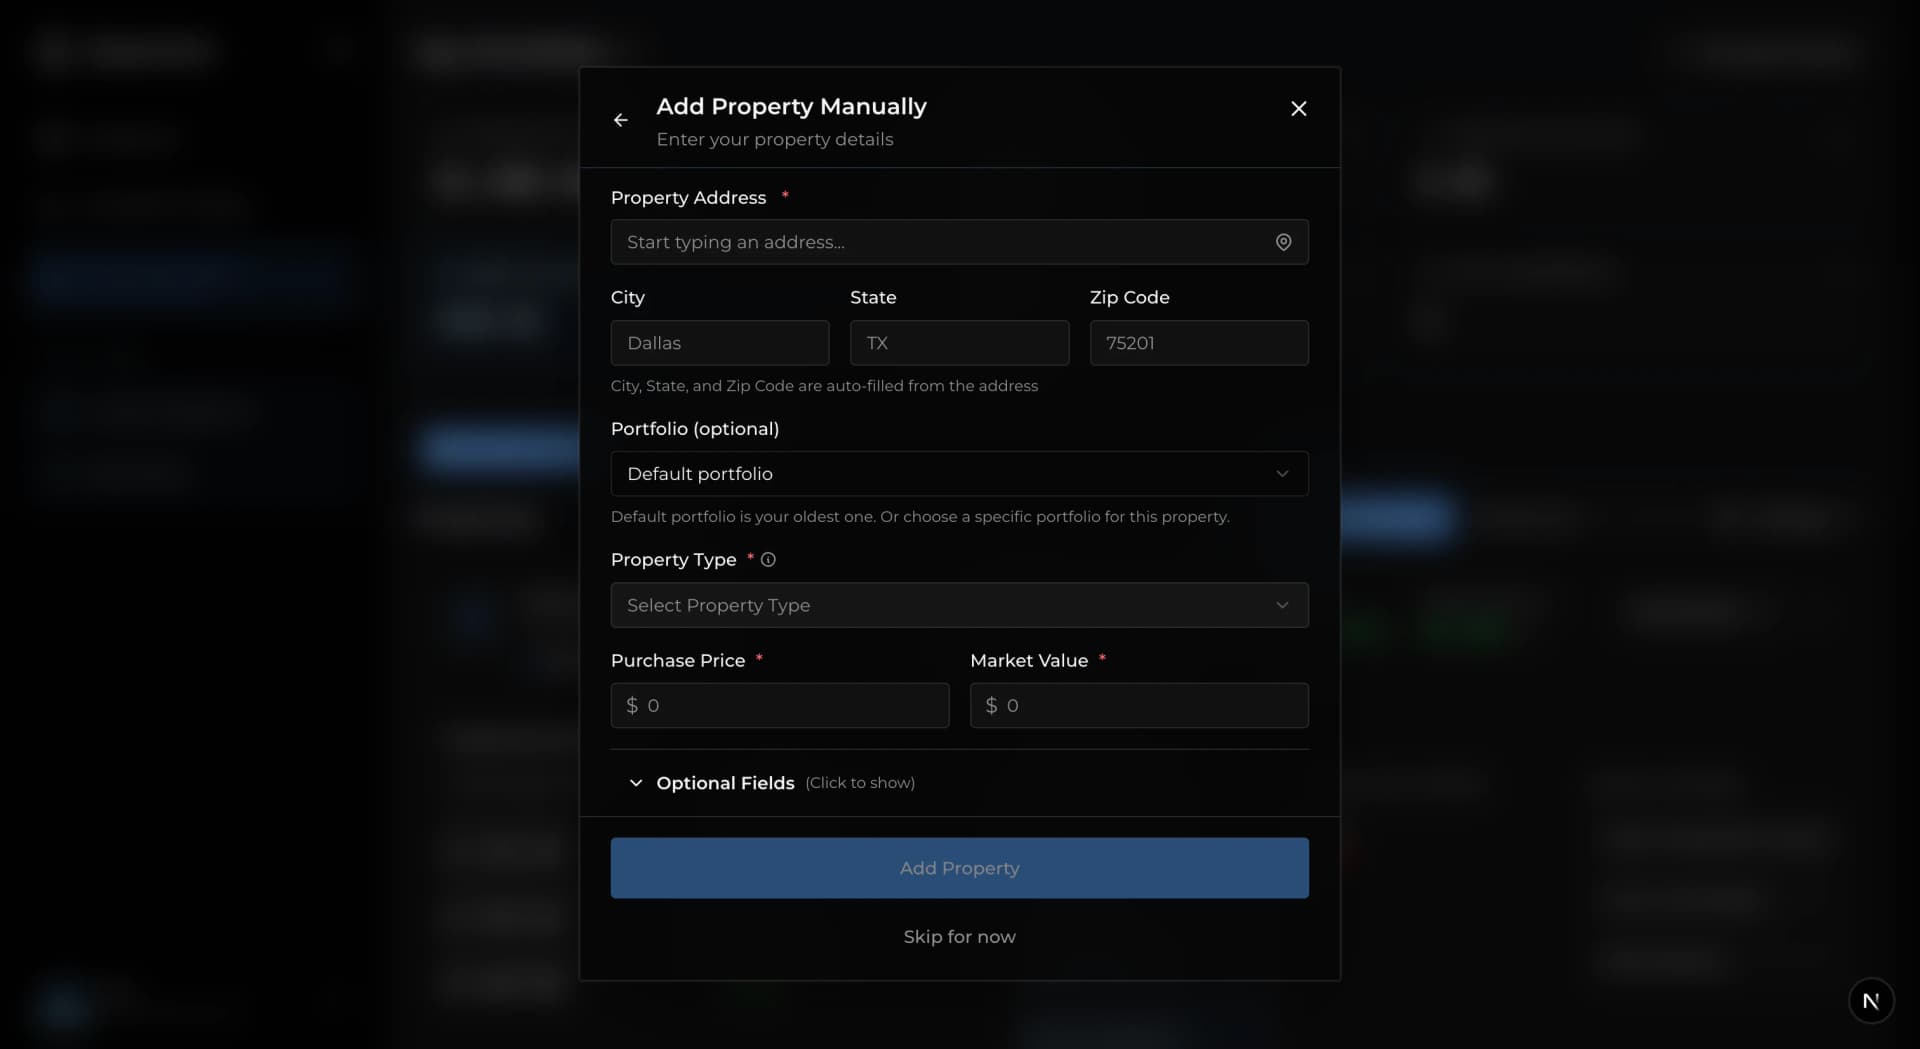
- < 10 minute setup
$0Always free